
Basal Body Temperature Chart (BBT) - PDF Celsius & Fahrenheit
Free Downloadable Basal Body Temperature Chart
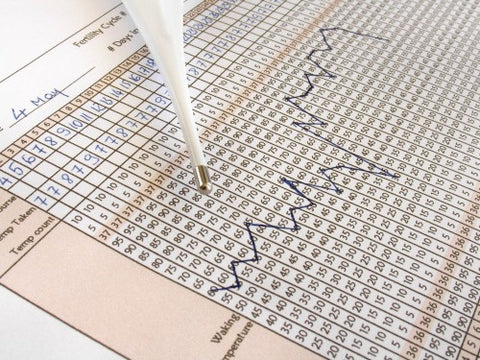
Download your free BBT chart, and you will be able to record and track:
– Daily Basal Body Temperature
– Cervical Mucus
– Cervical Position
– OPK Results
– Days You Had Sex
– Pregnancy Test Results
– Other notes, including illness, alcohol consumption, and poor sleep.
– Space to make additional notes
You can download the basal body temperature chart for recording in either Fahrenheit or Celsius. It is available in Pdf format.
PDF Basal Body Temperature Chart:
bbtchart.pdf - Fahrenheit bbtchart_c.pdf - CelsiusBenefits of Charting Your Basal Body Temperature (BBT)
Charting your basal body temperature provides valuable information if you are trying to get pregnant. Your resting, basal, body temperature will change during your cycle. Your bbt will be lower during the first part of your cycle. It will increase a little at ovulation. Most women see a .1 to .5 degree increase after ovulation happens. This slightly elevated basal body temperature will do one of two things. 1) Drop to the previous lower level when your period starts or 2) stay elevated, indicating that you are pregnant.Charting your temperature for two or more cycles will provide valuable insights. You will be able to figure out when you ovulate in your cycle. Knowing when you ovulate helps plan intercourse to encourage “baby making.” You will want to have sex a couple of days before you expect the temperature increase. The closer you get to the upward shift, the better your chances of getting pregnant.
Keep These Tips in Mind When Tracking Your BBT
The best way to determine when you’re ovulating is by charting your BBT for several months before trying to have a baby. Of course, there are minor fluctuations that may occur. Charting over many months will give you a pretty good idea of when you normally ovulate. Pinpointing ovulation will help you get pregnant more quickly. BBT charting gives you a bit more control over this trying to conceive journey.
Tracking your BBT temperature requires discipline. You must take your temperature every day, as soon as you wake up. Don’t get up and move around or go to the bathroom. Open your eyes, reach for your basal thermometer, and take your temperature. Using a basal thermometer is essential because it is more sensitive than a regular thermometer. They detect the small fluctuations to a tenth of a degree. Record it before you carry on with your day. By keeping your chart near your bed, you will find it easier to chart your BBT over time.
Download and print your free BBT chart. You can track your basal body temperature and other important factors, such as your cervical mucus and cervical position. From a long-term perspective, bbt charting will help you figure out when you ovulate. This will make it much easier to determine when the right time to have sex. And ultimately make it easier to get pregnant when you’re ready to begin a family.